Modeling Bird and Bat Collision Mortality at Wind Turbines in the Central United States
Landscape spatial models inform collision risks for birds and bats in the central United States

With the growing number of terrestrial wind farms, it's important the siting decisions consider impacts on wildlife. Large-scale models can inform where high-risk and low-risk sites are for species of concern, and developers can use this information in their siting decisions accordingly. Below, we present an approach and maps showing collision risk for six bird and three bat species in the central United States.
Background
Wind energy is a rapidly growing and relatively clean renewable energy source, which can ultimately meet increasing demands for electricity in the United States. Despite the considerable potential for wind energy production in the US and the minimal carbon emissions that occur from producing this power, the proliferation of wind energy has some drawbacks, including:
- Land disturbance from the installation of a wind facility,
- Potential decline in aesthetics of a landscape,
- Difficulty in attaining public acceptance, and
- Threats to aerial and terrestrial wildlife.
Wind project facilities pose two possible hazards to wildlife:
- Direct effects from collisions
- Indirect effects from displacement and alterations to habitat
While collisions and displacement effects can impact wildlife, this study only examined collision hazards. Most previous studies on collision impacts at wind facilities have occurred at the level of the wind facility and have only examined small-scale influences on collision.
In this study, we examine large-scale, landscape-level influences using a hierarchical spatial model combined with existing datasets and life history knowledge for six bird and three bat species:
- Horned Lark (Eremophila alpestris)
- Red-eyed Vireo (Vireo olivaceus)
- Mallard (Anas platyrhynchos)
- American Avocet (Recurvirostra americana)
- Golden Eagle (Aquila chrysaetos)
- Whooping Crane (Grus americana)
- Eastern red bat (Lasiurus borealis)
- Silver-haired bat (Lasionycteris noctivagans)
- Hoary bat (Lasiurus cinereus)
Our Study
These species were modeled in the central United States within Bird Conservation Regions 11, 17, 18, and 19.
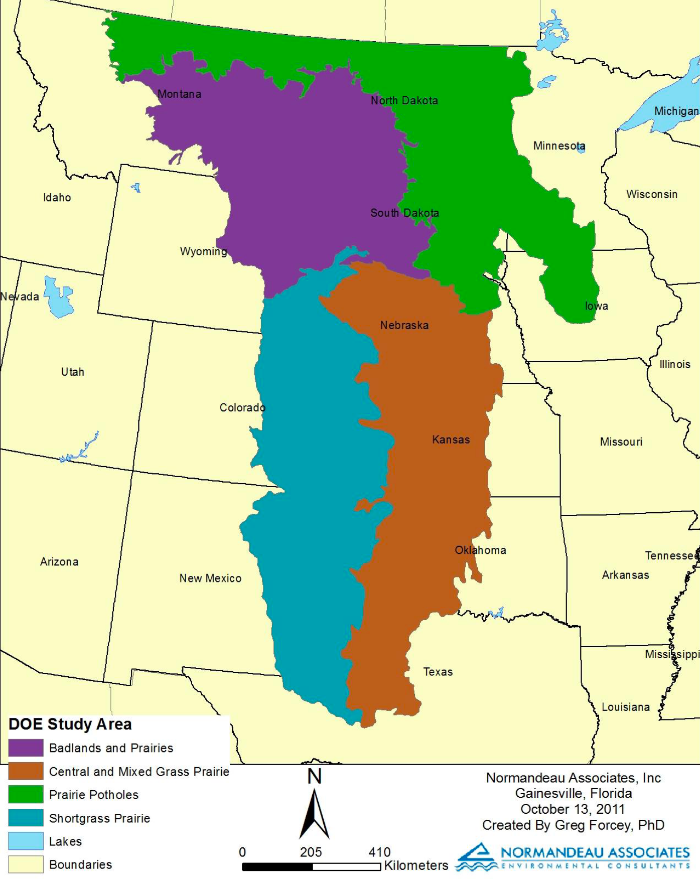
For birds, we modeled bird abundance from existing datasets as a function of habitat variables known to be preferred by each species to develop a relative abundance prediction for each species. There are no existing bat datasets, so we identified preferred habitats in the landscape for each bat species and assumed that greater amounts of preferred habitat would equate to a greater abundance of bats.
The abundance predictions for birds and bats were modeled with additional exposure factors influencing collisions, including visibility, wind, temperature, precipitation, topography, and behavior, to form a final mapped output of predicted collision risk within the study region. Separate collision models were derived for each season, given differences in habitat and behavior across seasons. Season-specific models were combined to create a cumulative model representing collision risk throughout the year.
We reviewed published studies from wind farms in our region to evaluate our collision predictions. We collected data on the mortality of our focal species to compare to our modeled predictions. Because of the uncertainty that abundance and exposure factors influence collision risk, we performed a sensitivity analysis evaluating model performance of 6 scenarios where habitat and exposure factors were weighted differently. We compared the model performance in each scenario by evaluating observed data from independent studies vs. our model predictions using Spearman’s rank correlations.
What We Found
- Horned Lark collision risk was predicted to be highest in the northwestern and west-central portions of the study region, with lower risk predicted elsewhere.
- Red-eyed Vireo collision risk was predicted to be the highest in the study region’s eastern portions, and the western portion’s forested areas; the lowest risk was predicted in the treeless parts of the northwest portion of the study area.
- Mallard collision risk was predicted to be highest in the eastern central portion of the prairie potholes and Iowa, which has a high density of pothole wetlands; lower risk was predicted in the more arid parts of the study area.
- The predicted collision risk for American Avocet was similar to Mallard and was highest in the prairie pothole region and lower in other areas.
- Golden eagle collision risk was predicted to be highest in the mountainous areas of the western portion of the study area and lowest in the eastern prairie potholes.
- Whooping Crane predicted collision risk was highest within the migration corridor that the birds follow through in the central portion of the study region; predicted collision risk was much lower elsewhere.
- Red bat collision risk was highly driven by large tracts of forest and river corridors, which comprised most of the areas of higher collision risk.
- Silver-haired bat and hoary bat predicted collision risks were nearly identical and driven largely by forest and river corridors, locations with warmer temperatures, and areas with lower average wind speeds.
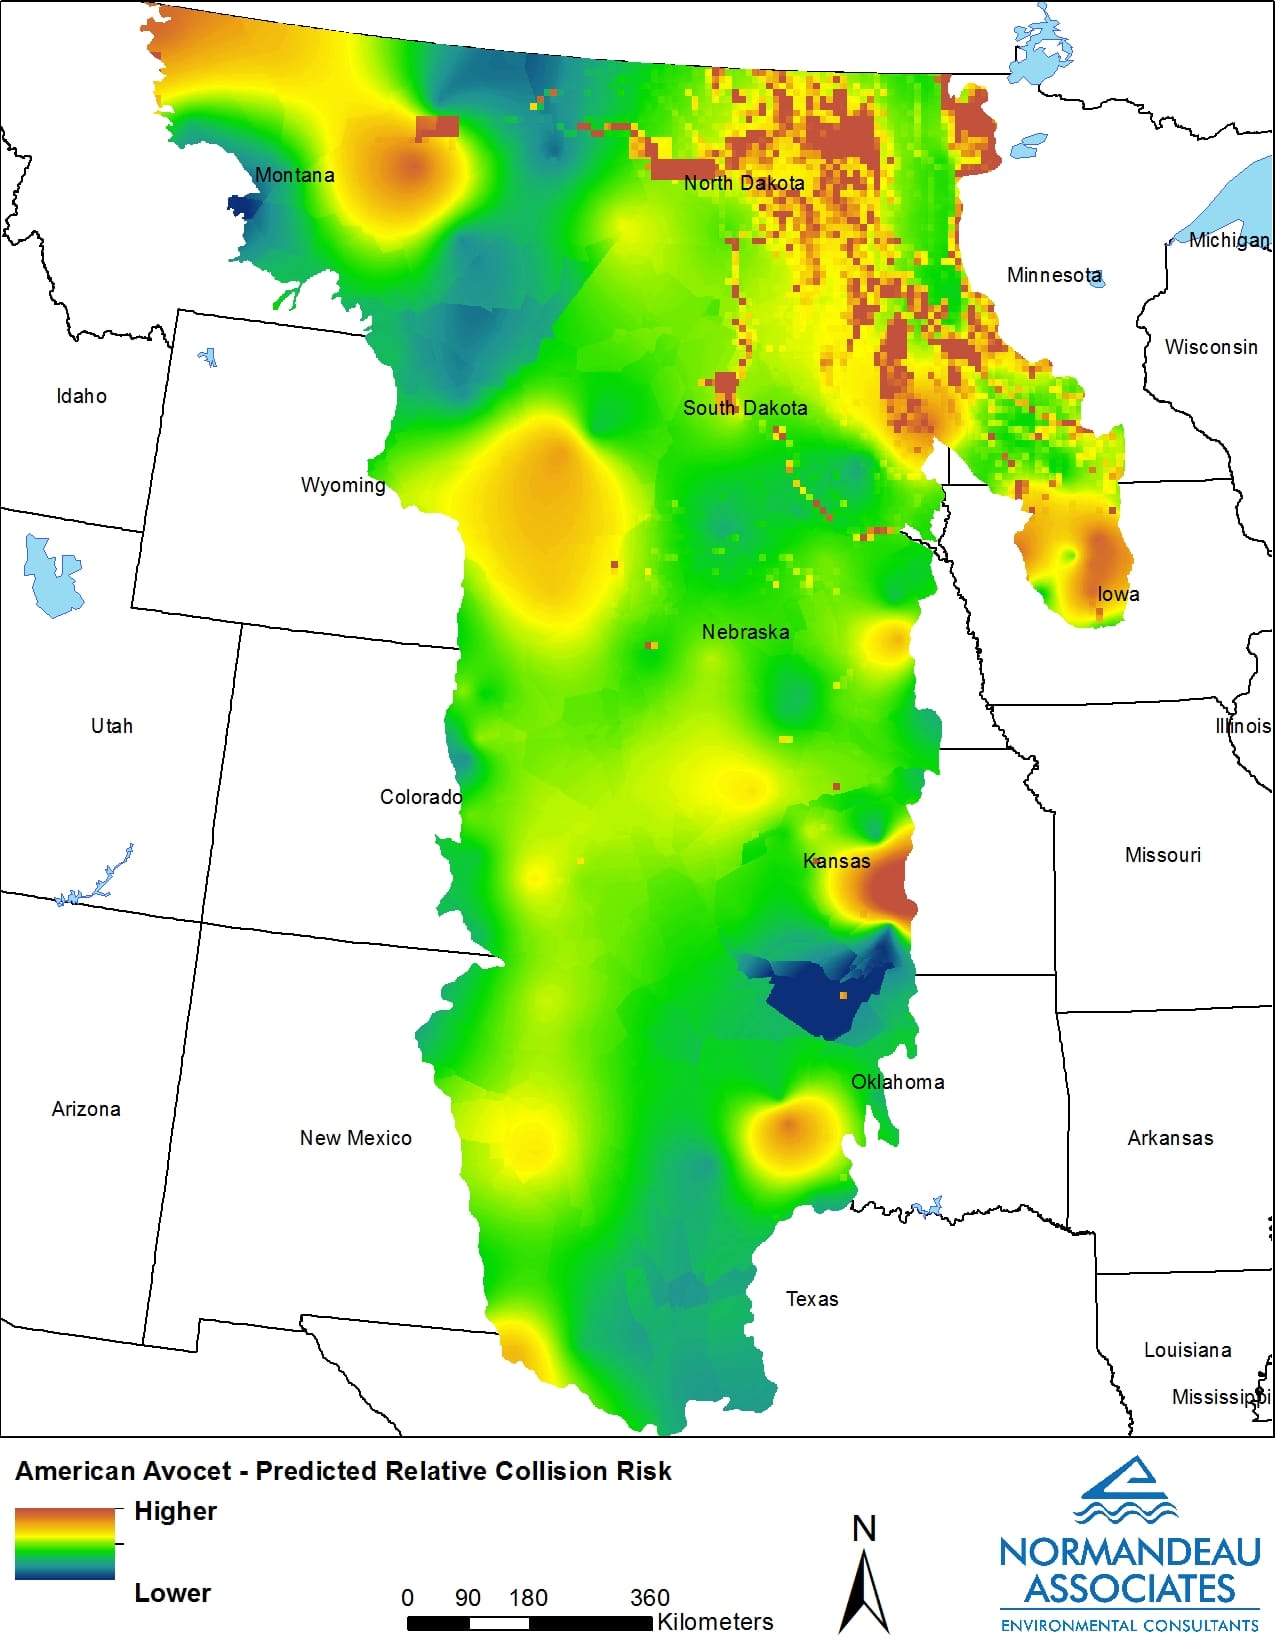
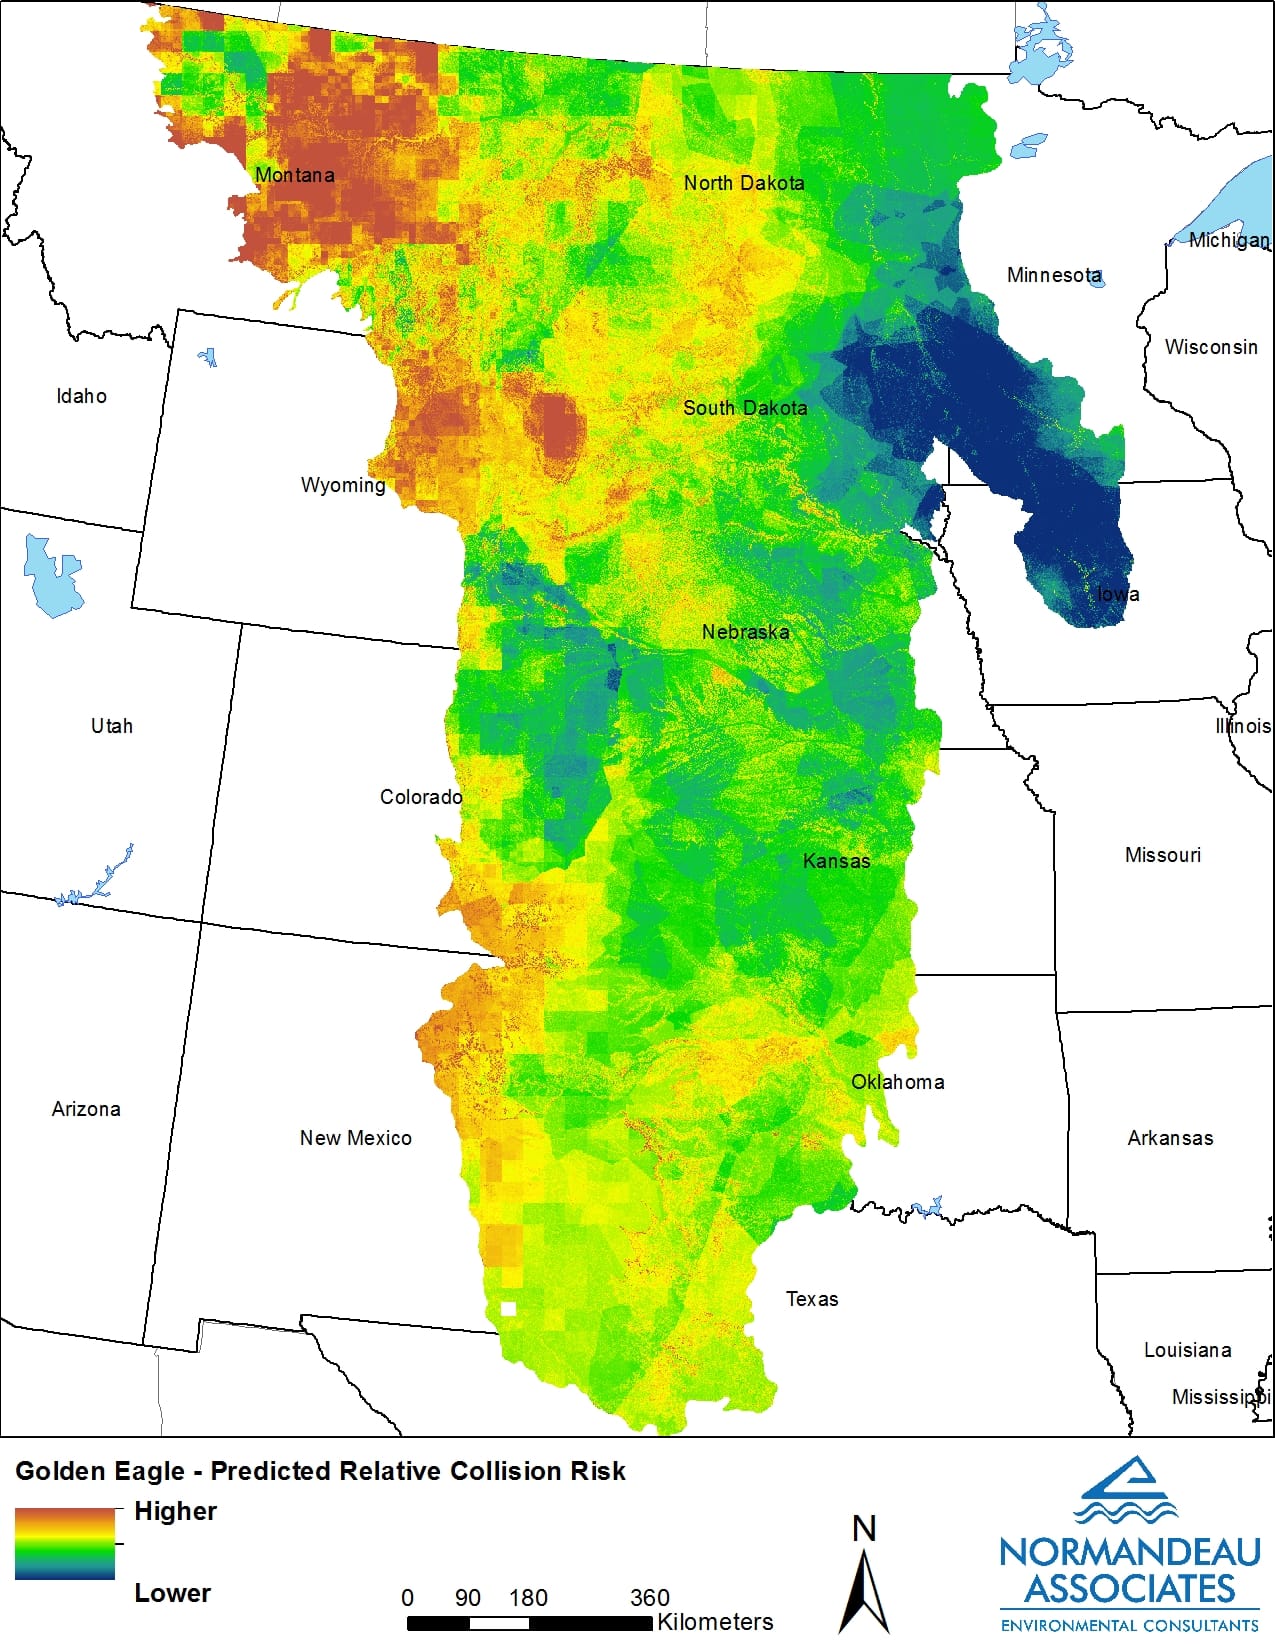
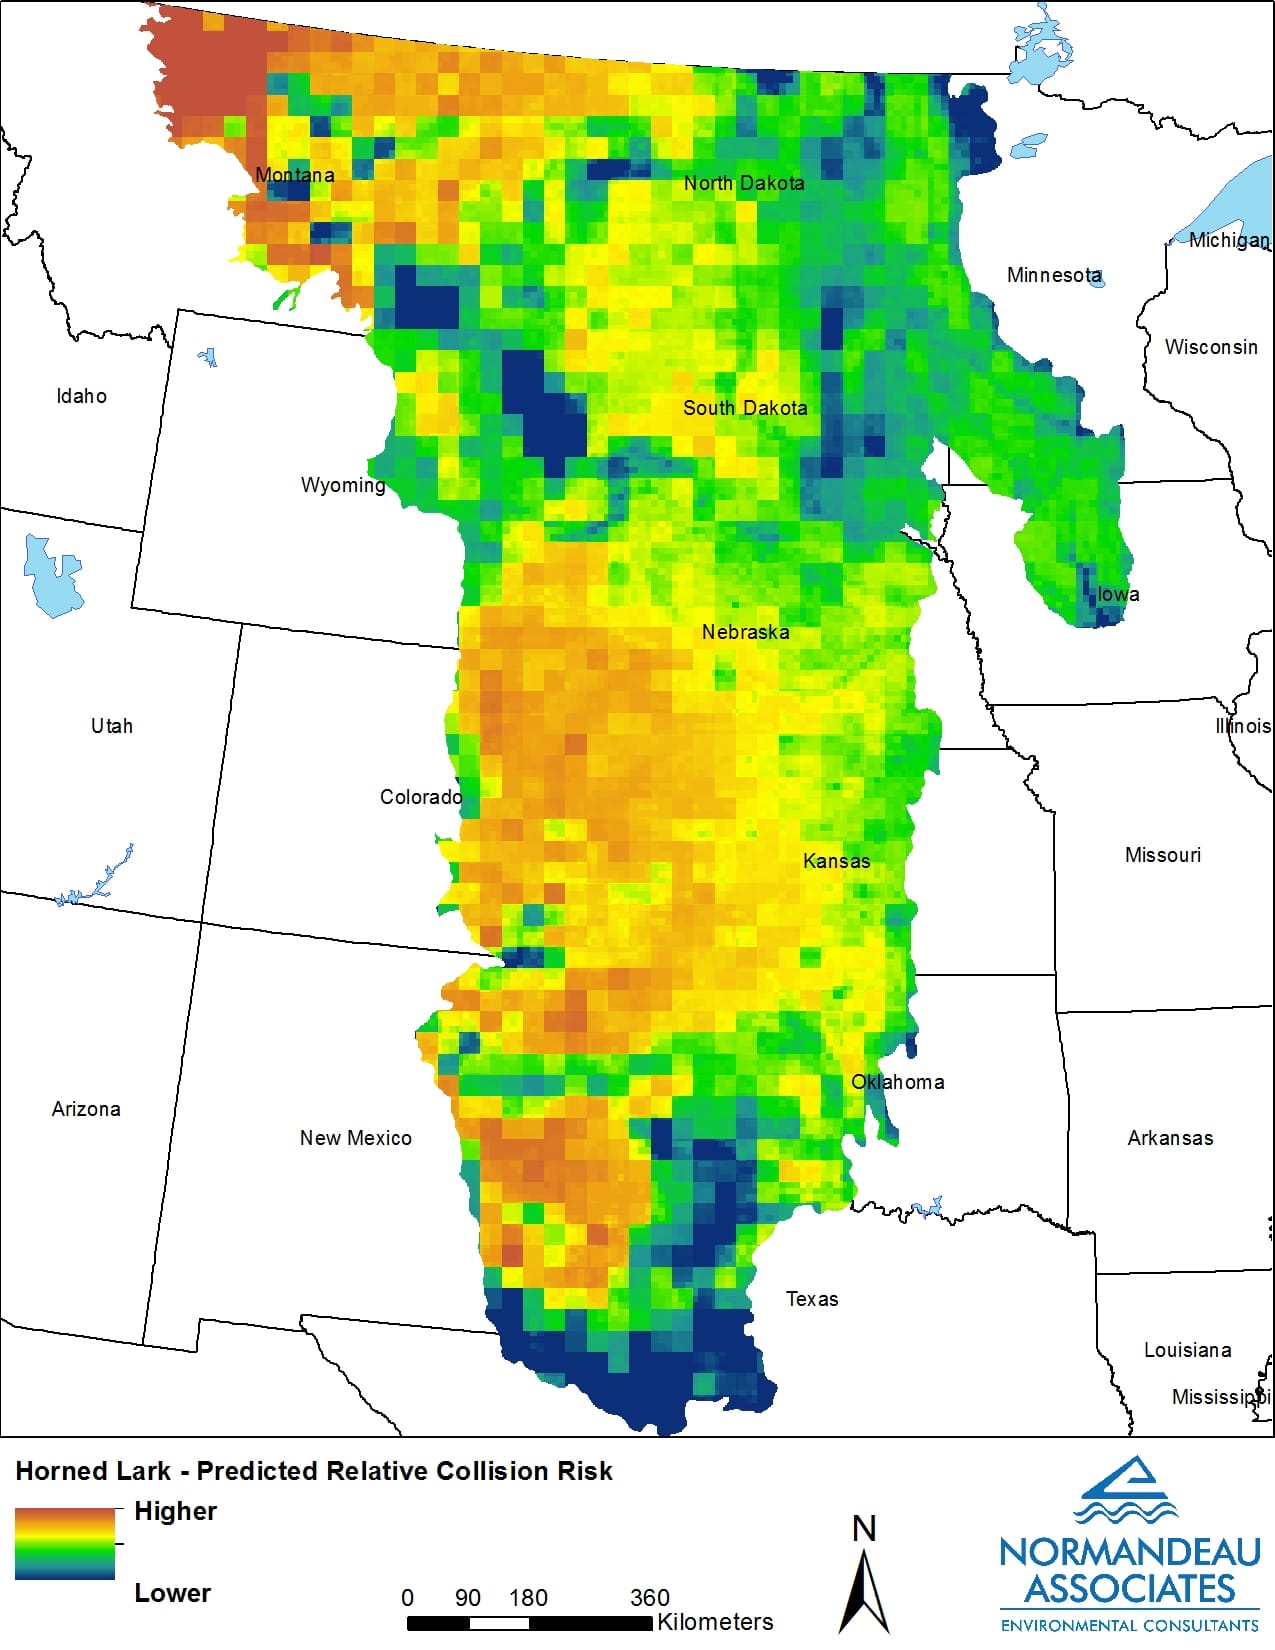
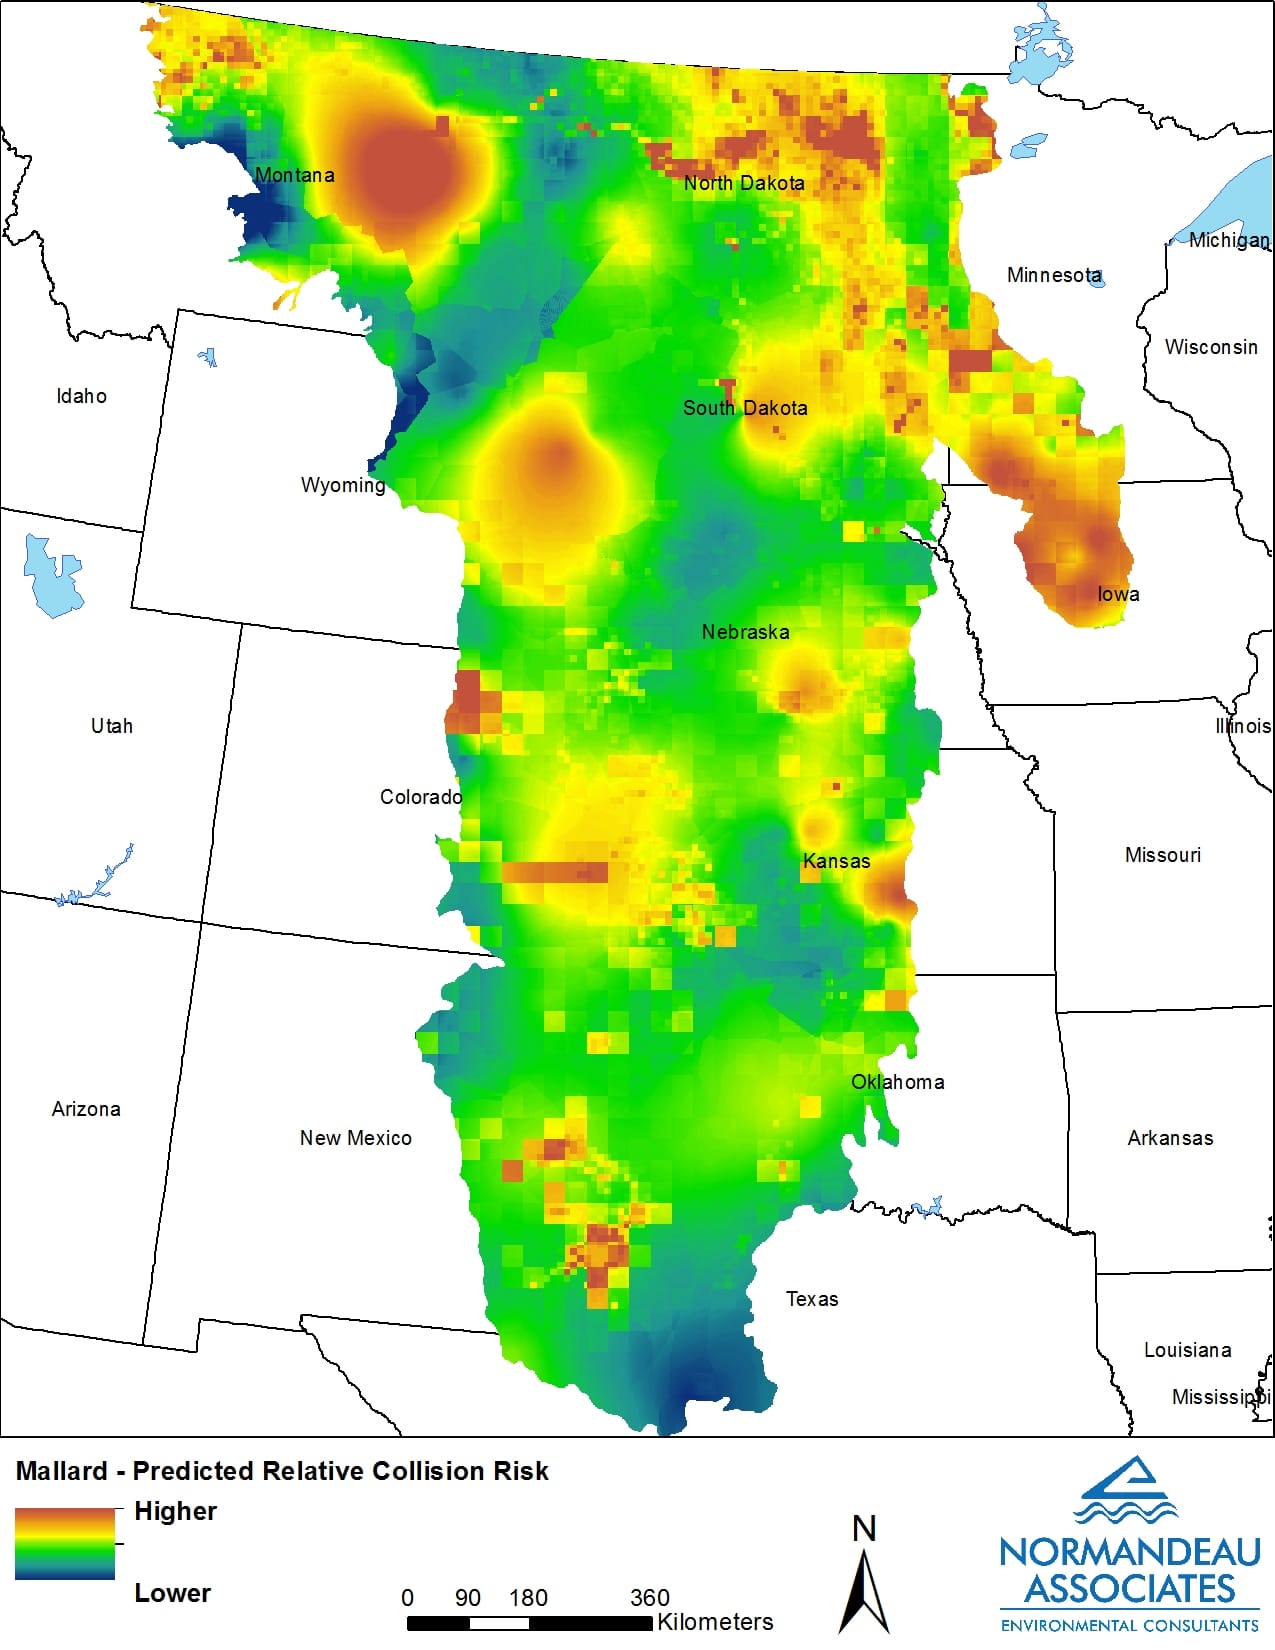
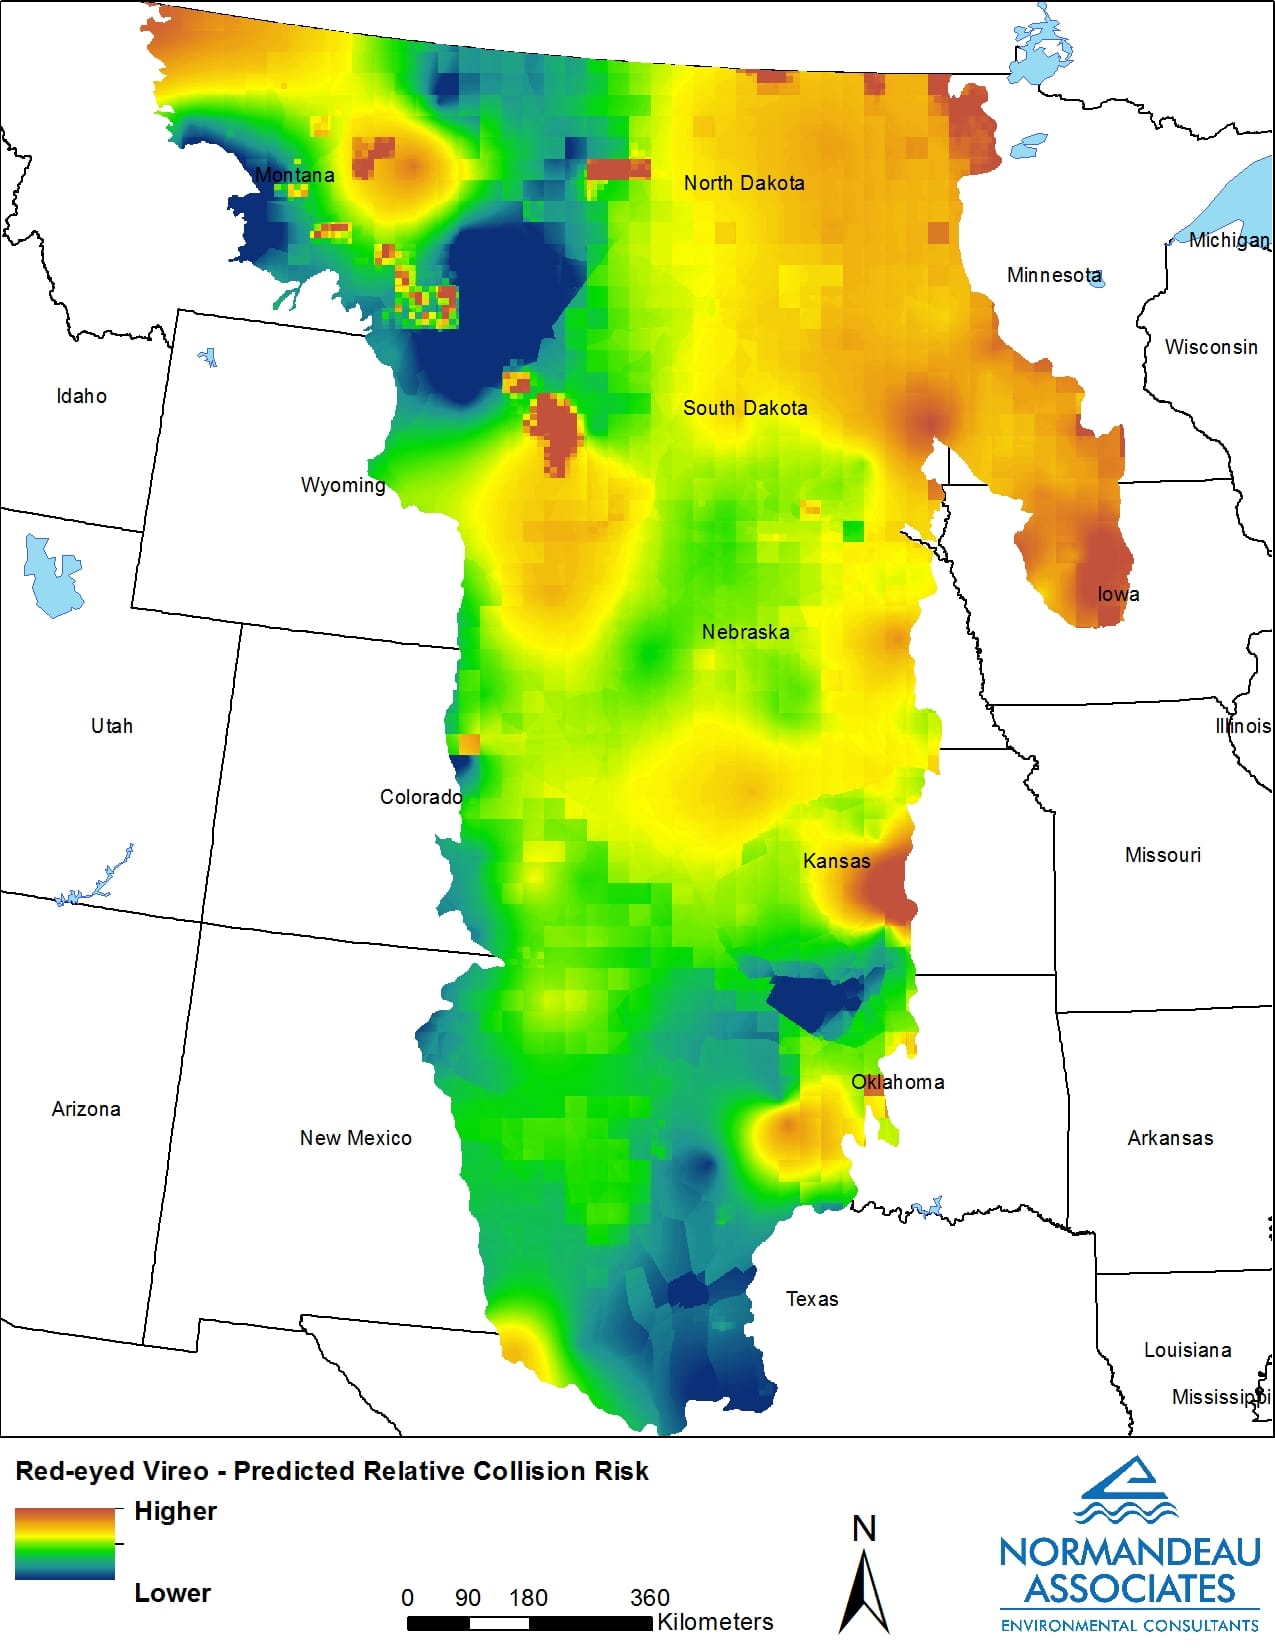
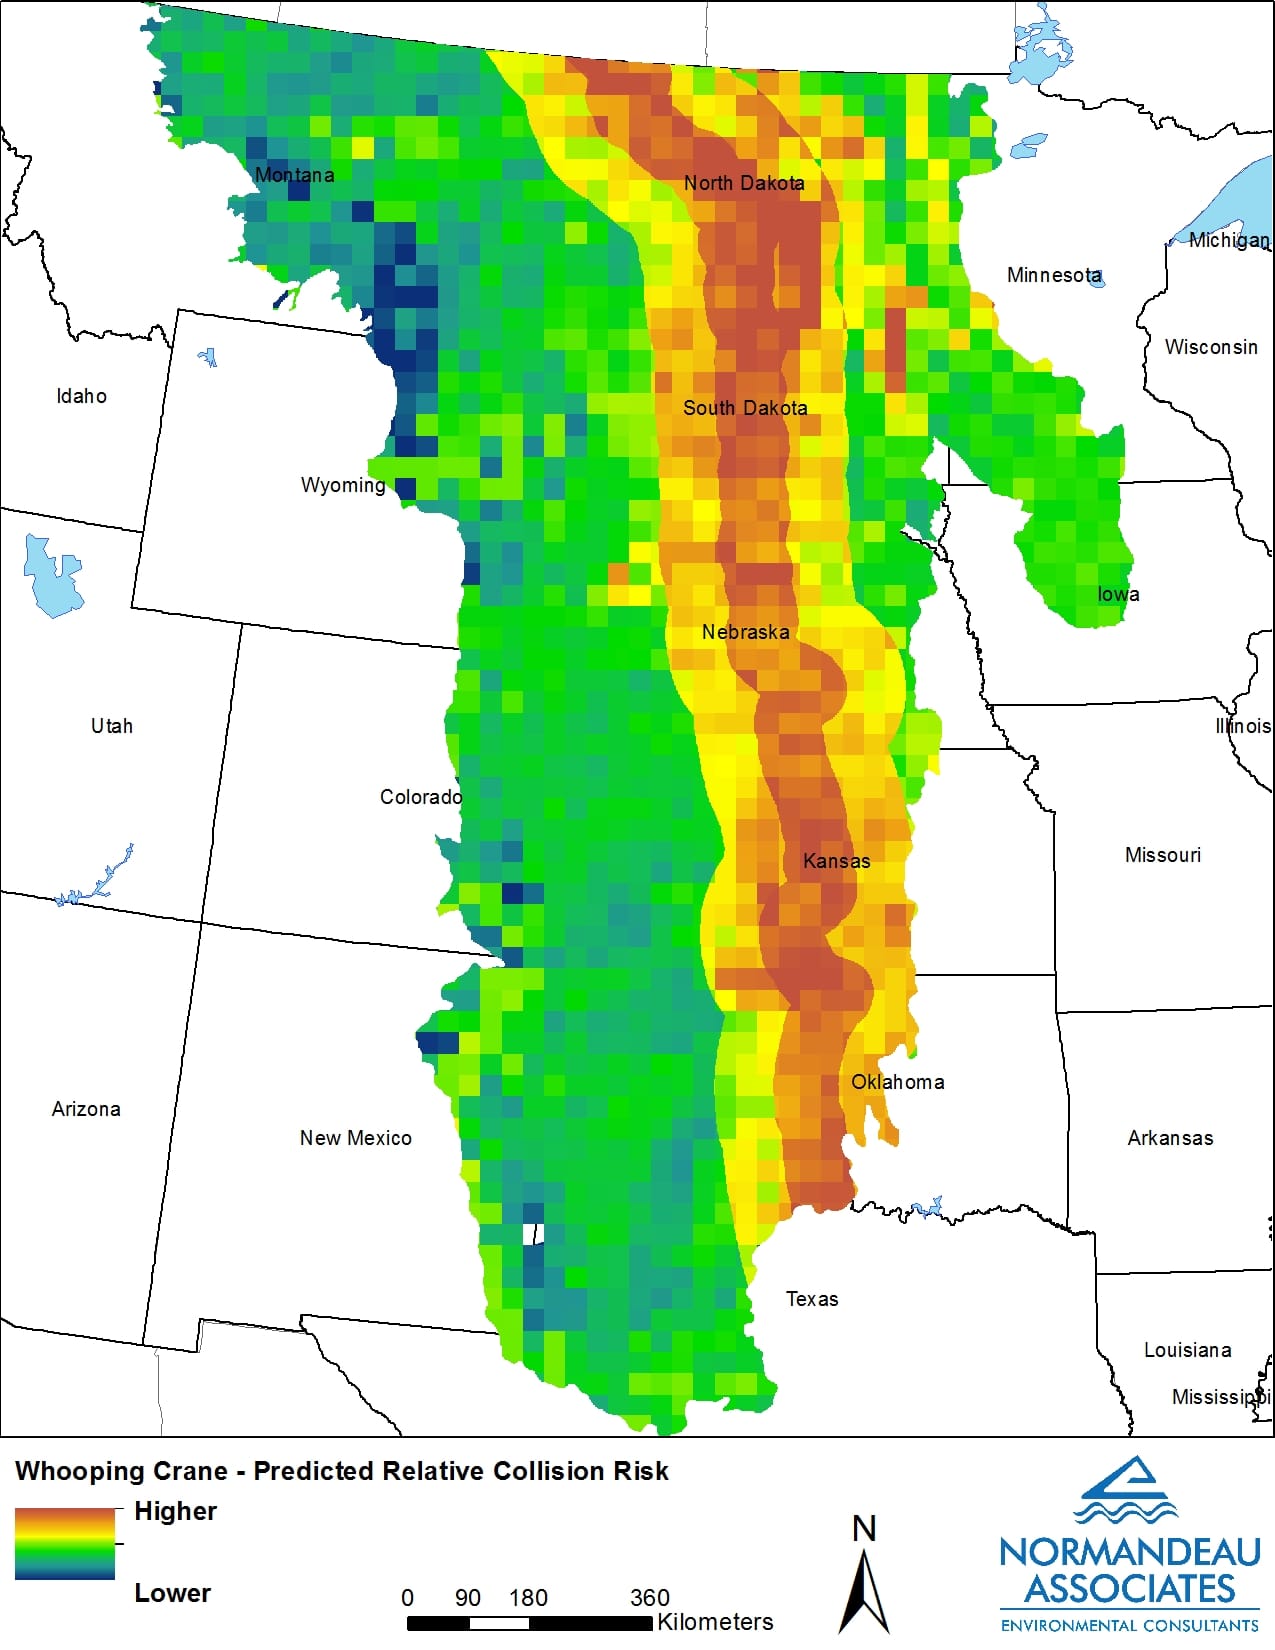
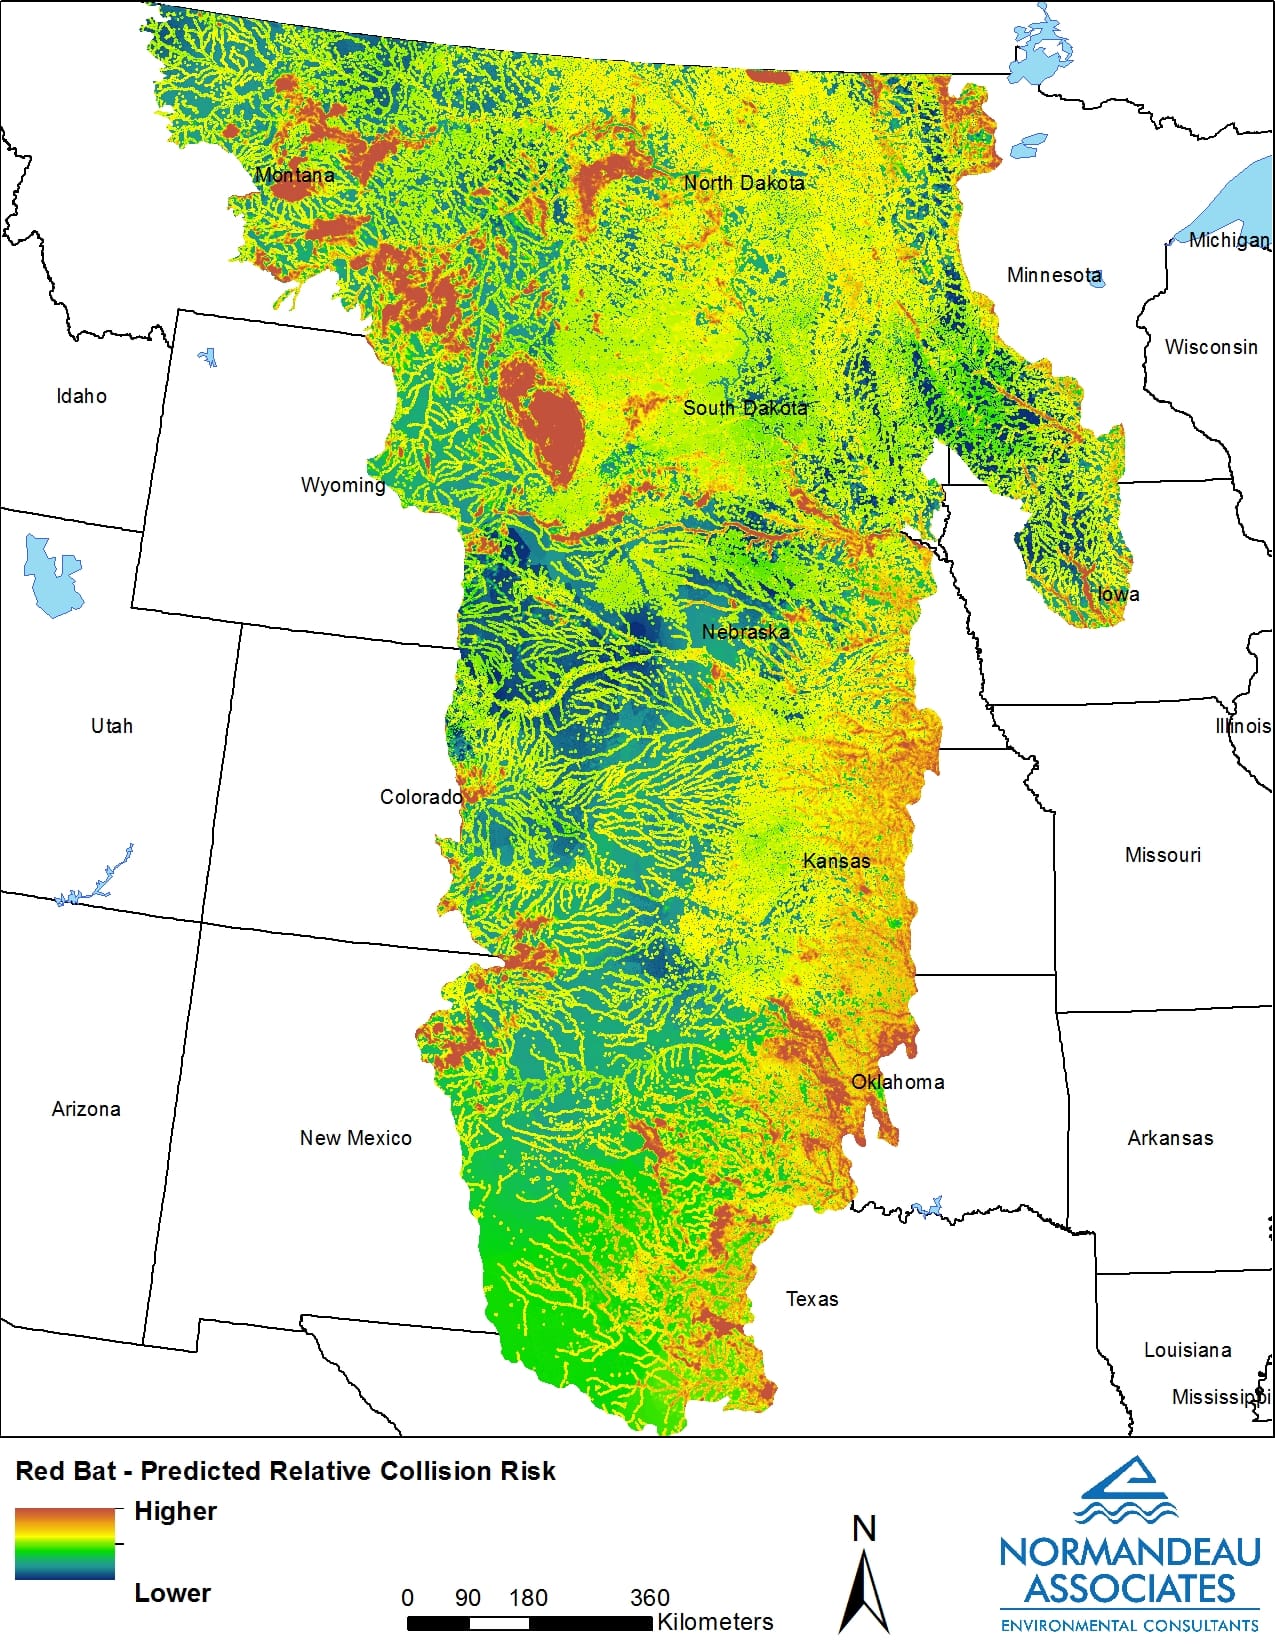
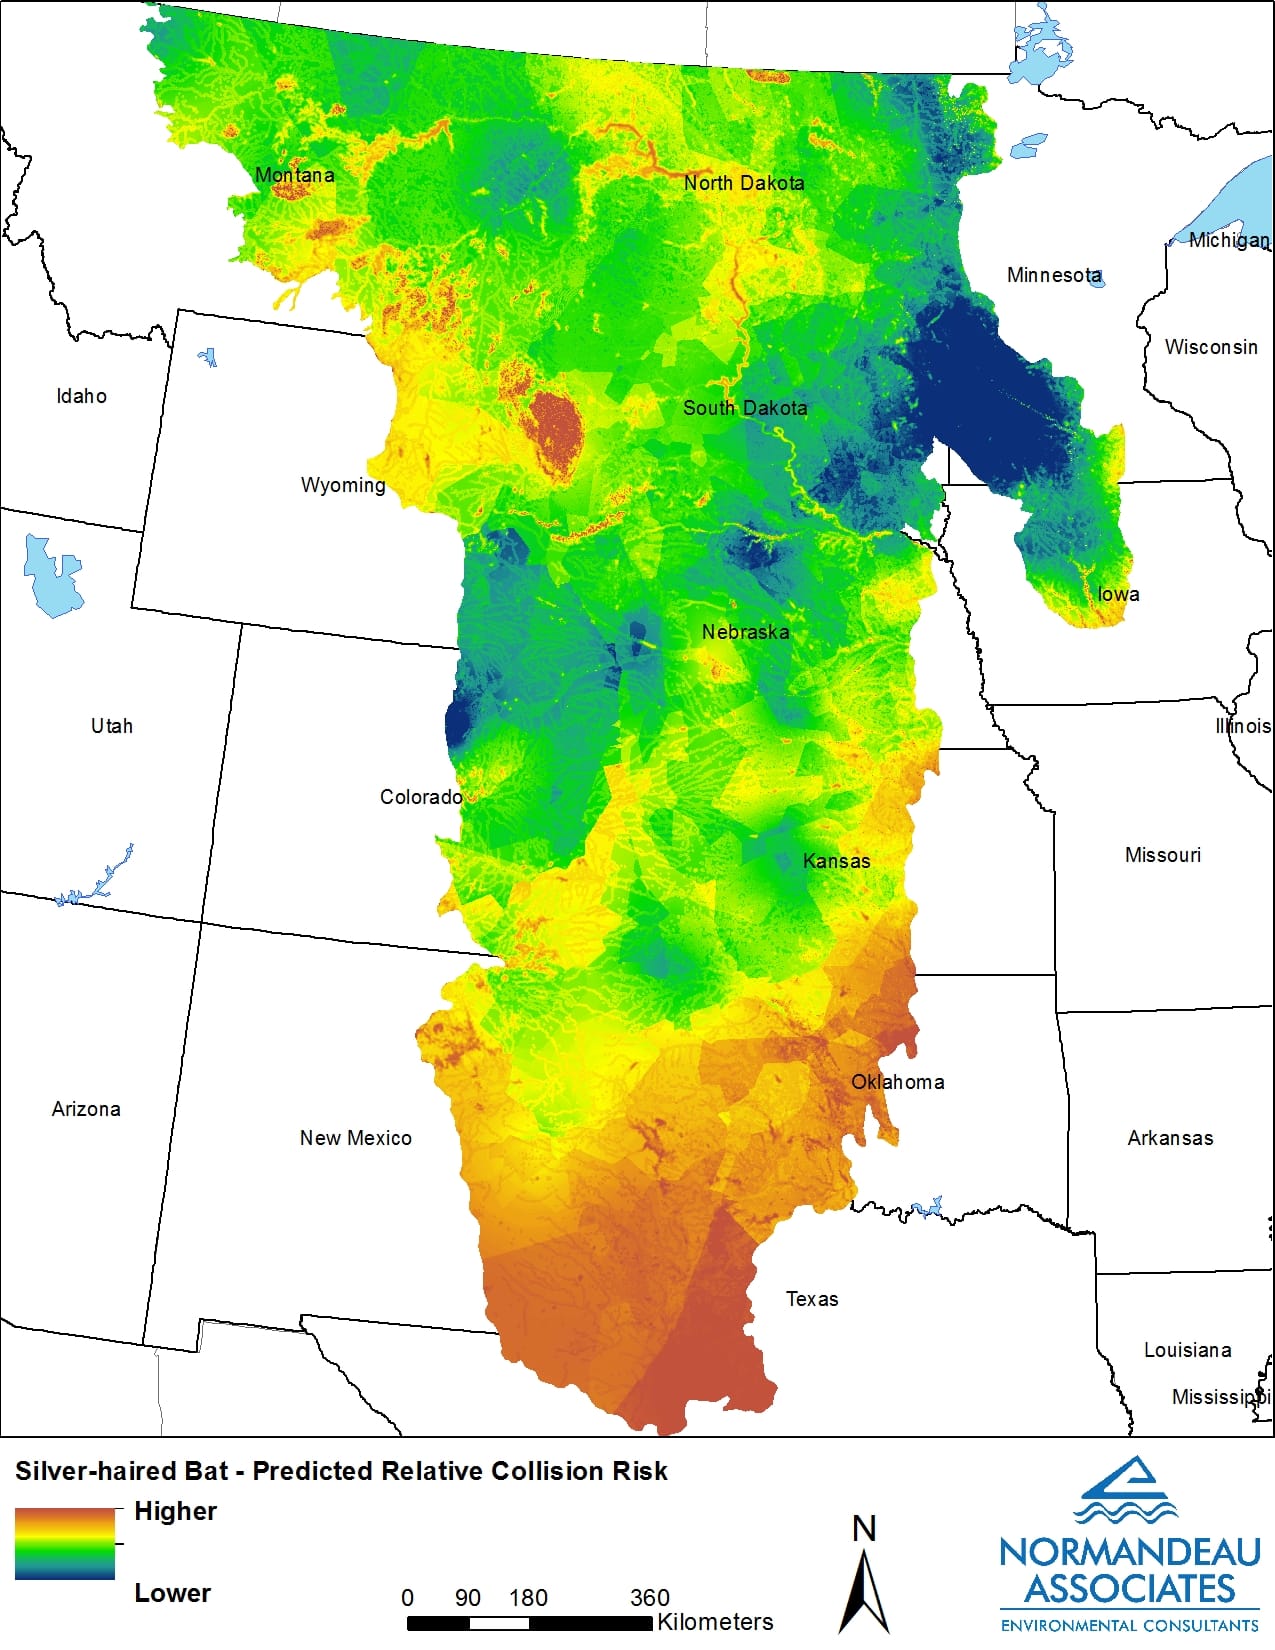
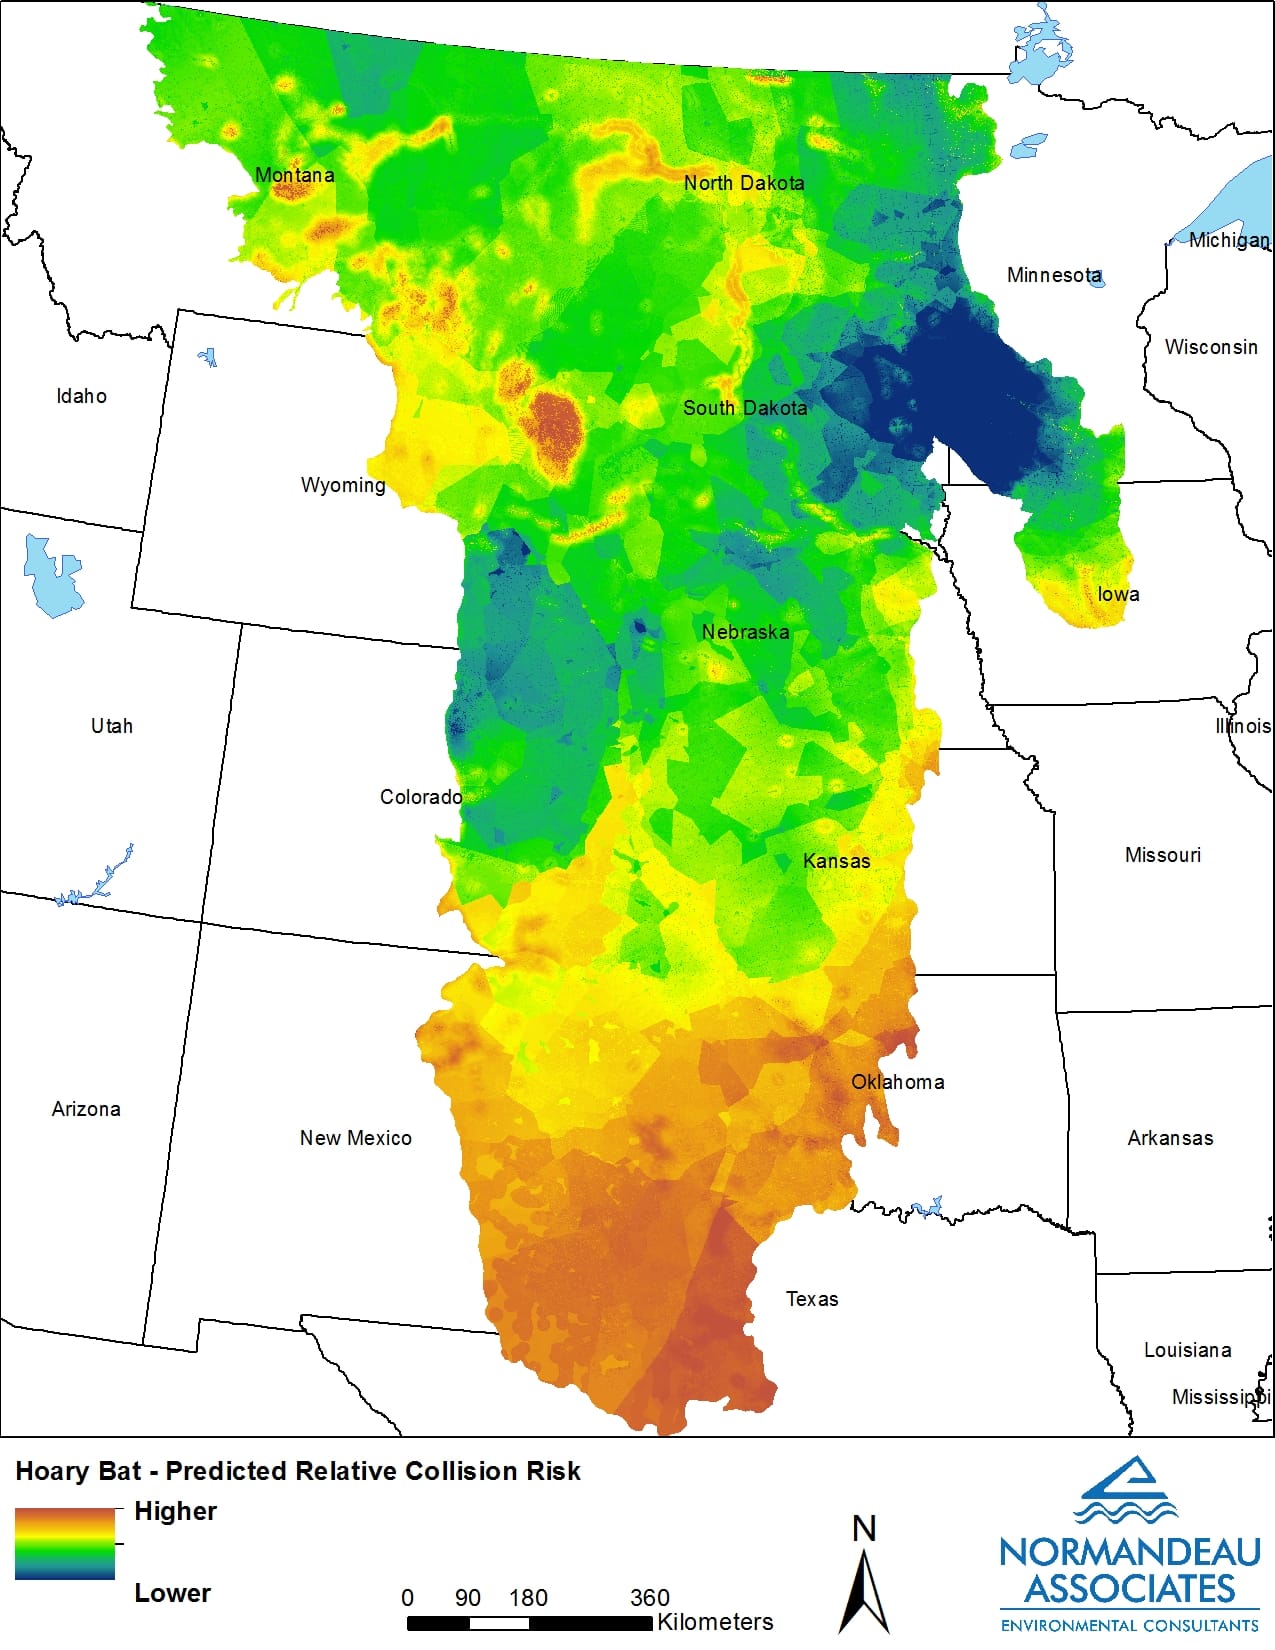
Predicted collision mortality risk for birds and bats in the central United States
Validation
Although available data were limited, we evaluated the Horned Lark, red bat, silver-haired bat, and hoary bat models to see how collision predictions compared to observed mortality from independent datasets. Horned Lark collisions were influenced mainly by abundance, and predictions showed a moderate correlation between observed and predicted mortality (r = 0.55). Red, silver-haired, and hoary bat predictions were much higher and strongly correlated with observed mortality with correlations of 0.85, 0.90, and 0.91, respectively. Red bat collisions were influenced primarily by habitat, while hoary and silver-haired bat collisions were influenced mainly by exposure variables. Stronger correlations between observed and predicted collisions for bats than for Horned Larks can likely be attributed to stronger habitat associations and greater influences of weather on bat behavior.
What Does It Mean
Our model outputs provide a convenient and easy landscape-level tool to quickly screen for wind facility siting issues at a high level. The model resolution is suitable for state or multi-county siting, but users are cautioned against using these models for micrositing. The U.S. Fish and Wildlife Service recently released voluntary land-based wind energy guidelines for assessing the impacts of a wind facility on wildlife using a tiered approach. The tiered approach uses an iterative process for determining effects on wildlife in increasing detail, from landscape-level screening to site-specific field studies. Our models presented in this paper would be applicable as tools for screening at the tier 1 level. It would be inappropriate to complete smaller-scale tier 2 and tier 3 level studies. For smaller-scale screening, ancillary field studies should be conducted at the site-specific level to validate collision predictions during permitting.
Although the collision predictions cannot be compared among species, the mapped outputs help show the relative predicted collision risk for a given species. They can be used to inform the siting process at a high level about how the collision predictions compare to other areas. Our model can be adapted to other species and geographic regions, assuming adequate input data are available. As improvements are made in the input datasets over time and more data becomes available, these models may be useful at smaller scales. Additional data from post-construction mortality monitoring would allow us to validate our models with a more extensive data set, providing extra confidence in the collision predictions.
References
Forcey, G., M. 2012. A habitat-based wind-wildlife collision model with application to the Upper Great Plains Region. US Department of Energy, United States. DOE Award DE-09EE0000529. <https://www.osti.gov/biblio/1049318>. Accessed 11 December 2022.
Kunz, T.H., and M. B. Fenton 2003. Bat Ecology. The University of Chicago Press, Chicago, IL. https://academic.oup.com/jmammal/article-abstract/85/2/366/2373575?redirectedFrom=fulltext
[USFWS] U.S. Fish and Wildlife Service. 2012. Land-Based Wind Energy Guidelines. https://www.fws.gov/media/land-based-wind-energy-guidelines